
Introduction
I can’t honestly remember when I first became entirely enamored of Canada Geese. I don’t have a first recollection in particular. It just seems like I’ve always been this way. Something happens to me when I hear that familiar ‘honking’ as they fly over. First, a sharp intake of breath, as one does at a moment of surprise. Then, an utter compulsion to stop whatever I’m doing at that moment and run (yes! run!) outside… or, at the very least to a window, to watch and listen to them pass over. It’s a reflex reaction that I can control if needs must. Seldom does the situation seem to warrant that. Thankfully most people understand my “Sorry! Geese!” as I point upward and run to the closest door or window.
Why do I react this way? In truth other bird sounds affect me too…just not quite much.
The ‘conk-ra-lee’ of a Red Winged Blackbird takes me right
back to a teenage me. Waking up on a spring morning, listening to the
blackbirds outside my window, watching the curtains blowing in the breeze and
thinking about all those things you think about as a teenager.
Or the way hearing a recording of British birdsong brings me
right back to all the mornings I enjoyed those same notes in my beloved England.
It fills me with a deep longing and homesickness for those places and those
people. I never know what the bird species are, but my ear discerns the
difference between those English birds and our birds here in Vermont. And my
heart knows.
This blog post is the culmination of 9 weeks of the Data Visualization and Communication class I am taking. It’s the last class I need to obtain my GIS Certificate from UVM. This is my final project. In it, I am supposed to tell my audience a DataStory. As I write this I am keenly aware that ‘I don’t know what I’m doing’, and sincerely wonder if I even will by the time this project is due at 11:59 pm on 23 March 2025. We shall see. I have struggled these last months because it seemed that my classmates were working on projects that will provide useful information to society at large, or even just someone other than themselves. I, on the other hand, have once again been marching to the beat of a different drum. My project is a personal one. About me, my mysterious, baffling, wonderful love of Canada Geese, and my own pending migration from my home—Vermont, westward to Kansas.
Who are these birds I am so enamored with?
It is not often that I give myself permission to spend 9 weeks focusing on a subject matter I love, just for the sake of it. Ok, yes, there has been a ulterior motive to this time--it's for my class. But I also hope that by the end of it I have maybe uncovered an answer, or partial answer to my question 'Why do I love Canada Geese'?
The latin name for Canada Geese is Branta canadensis. The genus name 'branta' comes from an old norse word meaning 'burnt'. They are in the family Anatidae, of the order Anseriformes.
Some further interesting facts:
 |
(Info from: Admin, A. (2025, March 17). Online bird guide, bird ID help, life history, bird sounds from Cornell. All About Birds. https://www.allaboutbirds.org/news/)

So... Will I Be Able To See Canada Geese in Kansas?

Hurray! YES! I will see Canada Geese in Kansas. All 105 counties in Kansas have recorded observations of Canada Geese. The entire eastern half of the state has a higher number of than the western half. And within the eastern half, there are two rather distinct areas; the northeast and the south central. The Counties with the largest number (darkest on the map) of cumulative observations between 1969 and 2024 inclusive are: Douglas, Johnson, Wyandotte, Sedgwick, Harvey and Stafford.
This is good news. Four of the counties - Douglas, Johnson, Sedgwick and Wyandotte- with the highest counts are on my 'prefered to live in list', plus one more, Riley. You are wondering how I have chosen my top 5 counties? Have I used my Advanced GIS course skills to make that determination? Hmmm. No. Nothing quite so scientific and research based. It's just that I have either lived there before, know someone who lives there, or have been offered a plot of land to grow willow. That is a data story for another day.
As for this data story, I could feasibly stop right there. Except that this is actually an assignment in Data Visualization. And, I happen to have a few more questions I'd like to know the answer to. For context lets see where my five counties are in the state. And, please note, the color coding in this next map will correspond with the data in the rest of the charts.

The dataset I am using for my analysis has come from one of the Cornell Lab websites, eBird (https://ebird.org/home). I highly recommend you go take a gander at that website for some much cooler visuals than I've managed to come up with. And, while I'm at it, two other Cornell websites that are fabulous and fun and full of useful information are; All About Birds (https://www.allaboutbirds.org/news/) and my absolute favorite for real time bird migration data (that I have mentioned in previous blog posts) is BirdCast (https://birdcast.info/). Birdcast is a collaboration between CornellLab, Colorado State University and UMassAmherst.
Back to eBird for a minute. Their data is collected by 'citizen scientists' which was old fashioned analog from 1969 until 2005 when the digital age arrived at eBird. This change is reflected in the data- to put it more acurately, in the amount of data available since 2005. All the data entered by citizen scientists is verified by eBird people before it is added to the dataset. However...
A Little Disclaimer... Maybe Big... You Decide
One thing I want to point out, I do have a bias in my data story, and it is this. I am not a research specialist, or a citizen scientist even. I am just a human being who loves Canada Geese and is taking a class (x4) to learn how to make data visualizations and maps.
Even though all the eBird data entries are verified before they are included in the dataset, it is feasible that 2 people on opposite sides of a pond might see the same flock of 20 Canada Geese and both enter 20 in their eBird data form, thereby duplicating the bird count. So instead of 20 the cumulative total is 40. That's what I am using. The cumulative, where those multiple entries have happened. I know there is a way to remove those duplicates--I watched a video, twice, by a professor in India explaining the process, but... I. Just. Didn't. Get. It. So, the reality is my numbers are probably not research quality accurate. Of course if this was a project for somebody else I would have found a way to sort out the duplicates, but since it's a project just for me, I didn't. They say pick your battles. There have been plenty others to choose from. I have lived to tell the tale. Onward.
eBird "Hotspots"
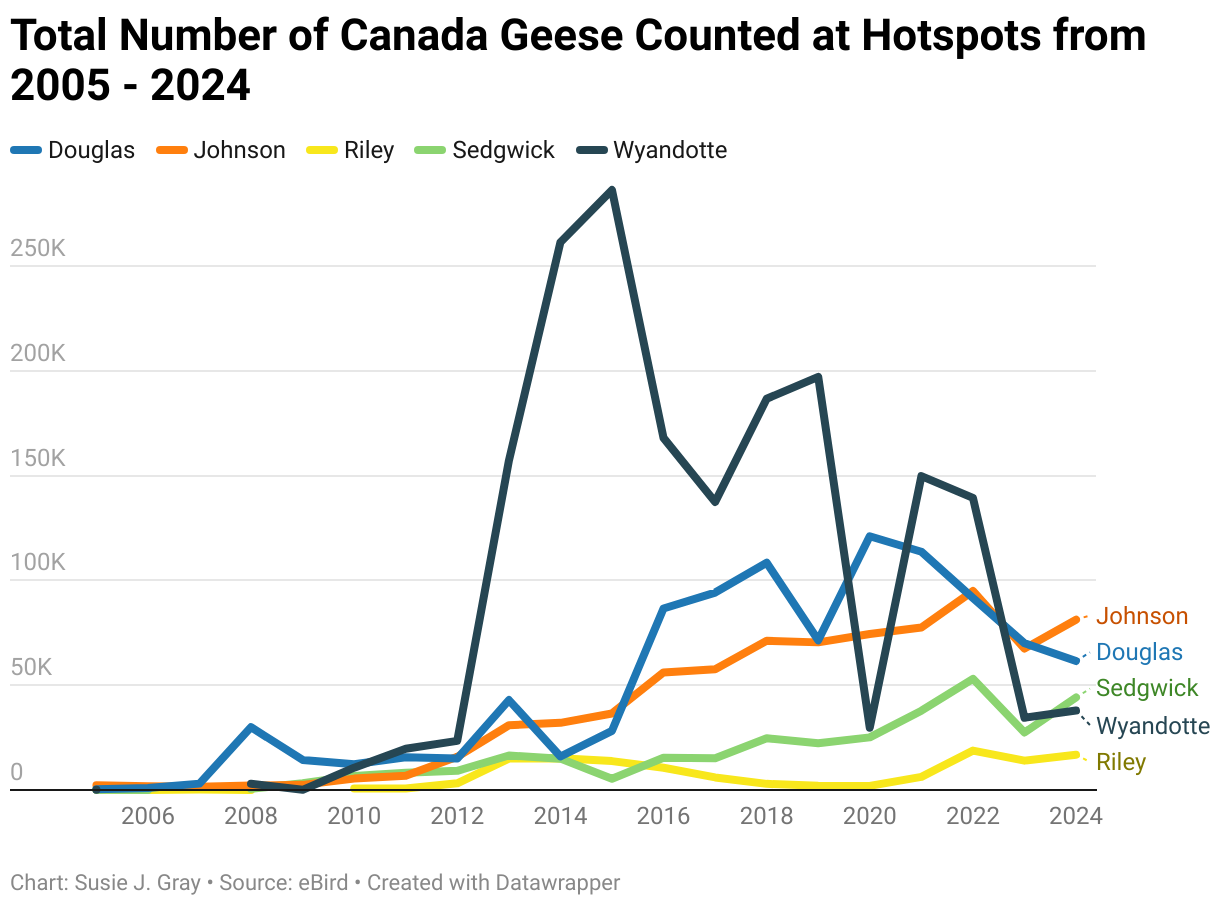
"Hotspots" are locations with 100% public access where people can go birding. My 5 counties have a combined total of 412 hotspots. (Douglas=84, Johnson=175, Riley=54, Sedgwick=76, Wyandotte=23).This chart shows the total number of geese at all the hotspots, in each county for every year 2005-2024 inclusive. Wyandotte has had the highest counts and the most fluctuation of my 5 counties. Interesting, isn't it, that it has the fewest hotspots?! I wonder what was going on in 2014 and 2015? I suspect this may be one of those 'duplicate records' instances, and will do some further detective work at a later date.
This is an interactive chart-hover over to activate!
https://datawrapper.dwcdn.net/PjqRX/5/
The chart below looks at hotspot totals for individual years and for each of the counties. Riley county seems to fluctuate, and Wyandotte's result reflects the huge numbers in 2014-2015, but, for the most part, there seems to be an increase in the number of Canada Geese in the other counties since 2005. And then an obvious decrease between 2020 an 2024 in Douglas county. I wonder why that is? Does it reflect a change in the year round resident population or the migratory population? Or a combination of the two? Another question, to dive deeper into at a future point in time.

Where am I Most Likely to See Canada Geese and When?
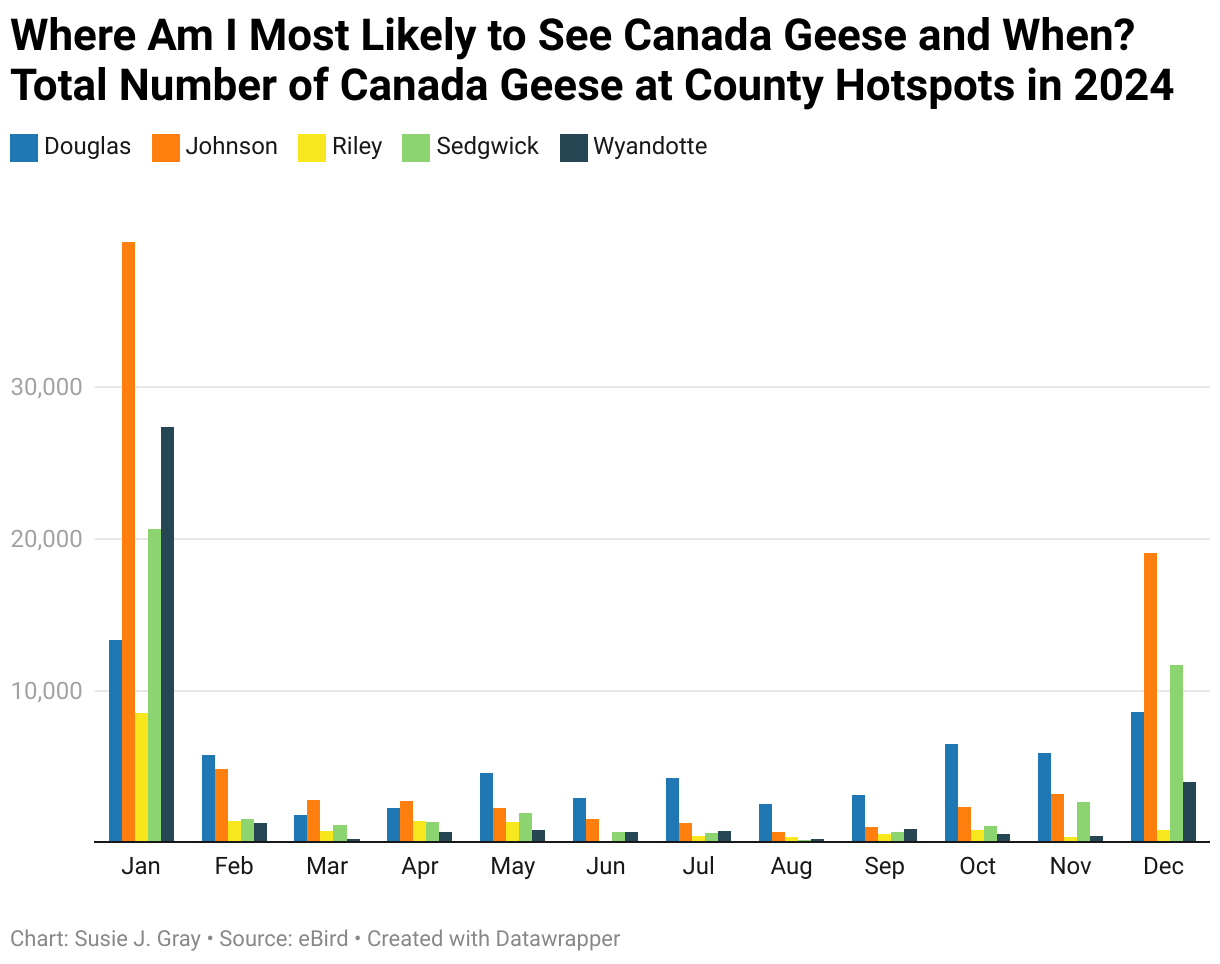
Taking a look at county hotspot counts from 2024, I am pleased to see some birds year round. May through September have the lowest counts. That is as expected, and indicates the year round resident Canada Geese population. Then there is an increase in October and November which corresponds to the return of migratory geese. December and January have the highest counts, in each of the counties. So, if I want to see those very large flocks of Canada Geese, it looks like January is the month and Johnson County is the place to be!
This is an interactive chart-hover over to activate!
https://datawrapper.dwcdn.net/G267Q/3/
I Am Migrating to Kansas!
Wild Geese
Mary Oliver
You do not have to be good.
You do not have to walk on your knees
for a hundred miles through the desert repenting.
You only have to let the soft animal of your body
love what it loves.
Tell me about despair, yours, and I will tell you mine.
Meanwhile the world goes on.
Meanwhile the sun and the clear pebbles of the rain
are moving across the landscapes,
over the prairies and the deep trees,
the mountains and the rivers.
Meanwhile the wild geese, high in the clean blue air,
are heading home again.
Whoever you are, no matter how lonely,
the world offers itself to your imagination,
calls to you like the wild geese, harsh and exciting—
over and over announcing your place
in the family of things.
(Oliver, M. “Wild Geese”. Wild Geese Selected Poems. BloodaxeBooks Ltd. (2004, January. https://maryoliver.com/)